
Richmond-Area Solar Permit Data & Methodology
Dominion Energy Solutions analyzed publicly available residential solar permit records from the City of Richmond, Henrico County, Chesterfield County, and Hanover County to create a local view of residential solar activity. The analysis covers July 1, 2025 through June 30, 2026 and is based on permits associated with actual residential solar projects rather than quote-marketplace or survey estimates.
Study period: July 1, 2025–June 30, 2026.
Last updated: August 2026.

What's the Average Home Solar System Size in Richmond, VA?
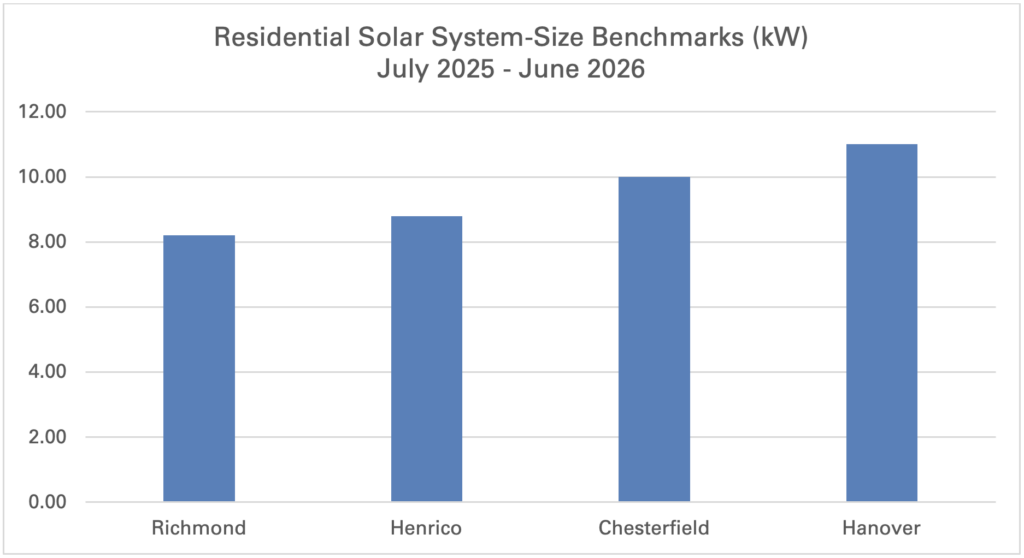
Our analysis of City of Richmond permit records found that new residential solar systems permitted from July 2025 through June 2026 averaged approximately 8.2 kW. Your own system may be larger or smaller depending primarily on annual electricity consumption, usable roof area, orientation, shading, and whether you plan to add loads such as an EV or heat pump.rnrnAcross Richmond, Henrico, Chesterfield, and Hanover, we identified 1,243 qualifying new residential solar installations from July 2025 through June 2026.* Systems with usable capacity data averaged approximately 9.3 kW regionally, with average system sizes generally increasing outside the urban core.
Across the four jurisdictions – Richmond, Henrico, Chesterfield, and Hanover – we identified 1,243 qualifying new residential solar permits during the 12-month study period. Usable capacity evidence was available for 924 systems, or about 74% of the qualifying installation population. Among systems with usable capacity data, the regional analytical average was approximately 9.3 kW.
| Jurisdiction | Number of PV Permits July 2025 – June 2026 | Systems With Usable Capacity | Capacity Coverage | Local System-Size Benchmark |
| City of Richmond | 130 | 112 | 86% | ~8.2 kW |
| Henrico County | 539 | 422 | 78% | ~8.76 kW |
| Chesterfield County | 415 | 300 | 72% | ~10.05 kW |
| Hanover County | 159 | 90 | 57% | ~11.0 kW |
Figure 1. Qualifying new residential PV permits identified in the comparable 12-month study period.
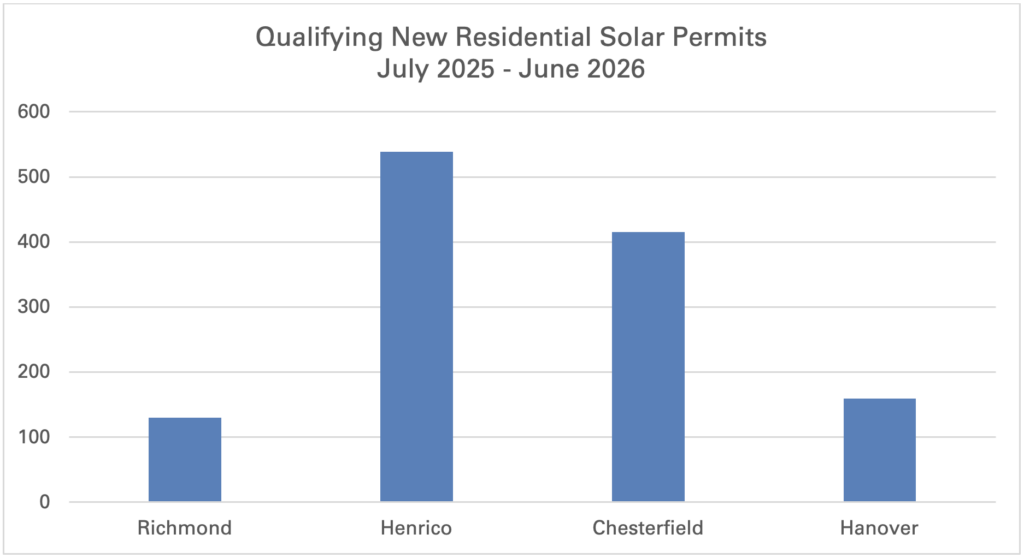
Figure 2. Jurisdiction-level system-size benchmarks used in the Richmond-area analysis.
What Counts as a New Residential Solar Installation?
The analysis was designed to identify permits representing new residential photovoltaic (PV) installations during the study period. Permit descriptions, classifications, and associated records were reviewed to distinguish new systems from other electrical, building, battery, and solar-related work.
Included: New residential PV systems, including new PV systems installed with battery storage when the permit represented a new solar installation.
Excluded where identifiable: Battery-only projects, additions or expansions to existing PV systems, panel or equipment replacements, detach-and-reset work, revisions, cancelled or withdrawn projects, and other records that did not represent a new residential PV installation.

How Was System Size Calculated?
When a permit provided an explicit system capacity, that capacity was used directly or recovered from the permit record. When total capacity was unavailable but panel count was available, a jurisdiction-specific panel-watt assumption was used where the underlying permit evidence supported that approach. Records without enough information to determine or reasonably estimate capacity remained in the installation count but were excluded from calculations requiring system size.
This is why the analysis reports capacity coverage alongside system-size results. Coverage differs by jurisdiction: approximately 86% in Richmond, 78% in Henrico, 72% in Chesterfield, and 57% in Hanover. The regional 9.3 kW analytical average therefore describes the 924 systems with usable capacity evidence, not a measured average of all 1,243 qualifying installations.

How Was the Richmond-Area Cost Benchmark Calculated?
Henrico County permit records provide both reported project value and usable system capacity for a substantial subset of qualifying new residential PV installations. For those records, project value per watt was calculated by dividing reported project value by system capacity in watts. The raw sample contained 422 systems, with a median of approximately $3.08 per watt.
As a quality-control check, an interquartile-range (IQR) screen was used to identify anomalous high- and low-side values. After that screen, 401 systems remained. The filtered mean was approximately $3.02 per watt, and the filtered median was approximately $3.04 per watt. Because these measures converge near $3.00 per watt, Dominion Energy Solutions uses approximately $3.00/W as a consumer-facing Richmond-area permit-derived benchmark.
Permit-reported project value is a useful local project-cost proxy, but it is not a verified homeowner invoice. Actual pricing can vary with equipment, roof and electrical conditions, battery storage, financing, and installation scope. The approximately $3.00/W figure should therefore be used as a market benchmark rather than a project quote.

How Should These Numbers Be Interpreted?
Public permitting systems were created to administer building and electrical work, not to serve as market-research databases. Reporting practices differ by jurisdiction, and fields such as system capacity, panel count, contractor, and project value are not consistently available for every permit. The figures on this page are therefore Dominion Energy Solutions’ permit-derived analysis of the public records, not official statistics published by the four jurisdictions or by Dominion Energy Virginia.
The jurisdiction benchmarks are useful for understanding what is being permitted locally, but they should not be used to size an individual home. A homeowner’s system should be designed around annual electricity use, available roof or ground area, orientation, shading, equipment selection, and anticipated future loads.
Source: Richmond-Area Residential Solar Market Report – 2026
Analysis by Dominion Energy Solutions
Data period: July 1, 2025–June 30, 2026
Published: August 2026
Sample: 1,243 qualifying residential PV installations
This analysis was last updated in August 2026 and covers permits issued from July 1, 2025, through June 30, 2026. Dominion Energy Solutions may periodically refresh the analysis as additional permit records become available. Published figures may therefore change as the underlying dataset is updated or classifications are refined.